Cassandra
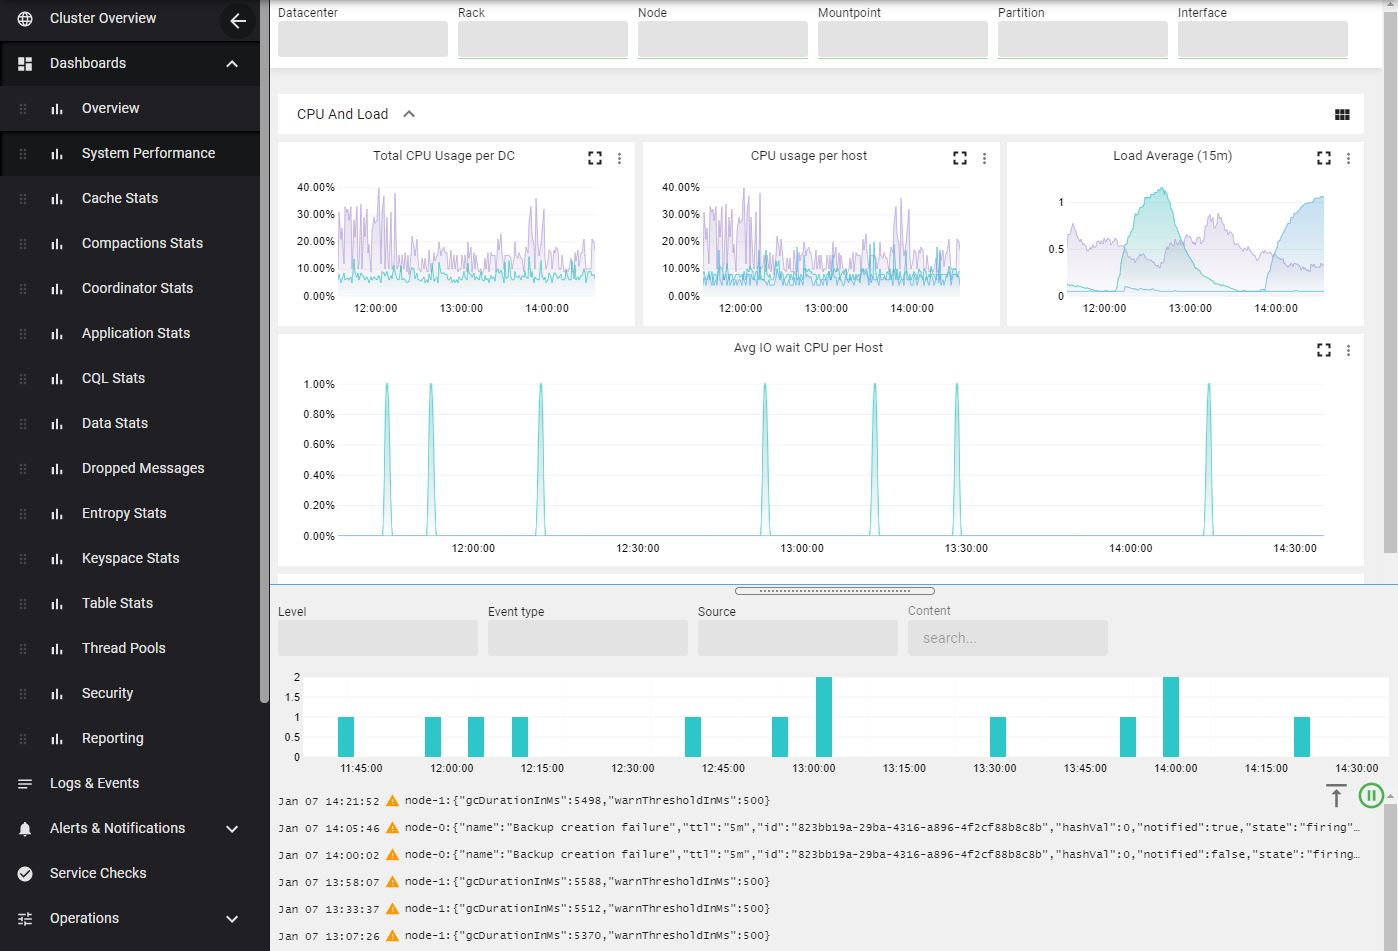
AxonOps dashboards provides a comprehensive set of charts with an embedded view for logs and events.
You can correlate metrics with logs/events as you can zoom in the logs histogram or metrics charts to drill down both results.
Alert rules can be defined graphically in each chart and Log collection is defined in the bottom part of that page.
Infomy